Analysis and insight
By the end of this module you will be able to:
- Distinguish descriptive, diagnostic, predictive, and prescriptive analytics
- Explain feature engineering in machine learning contexts
- Connect analytics outputs to business decisions
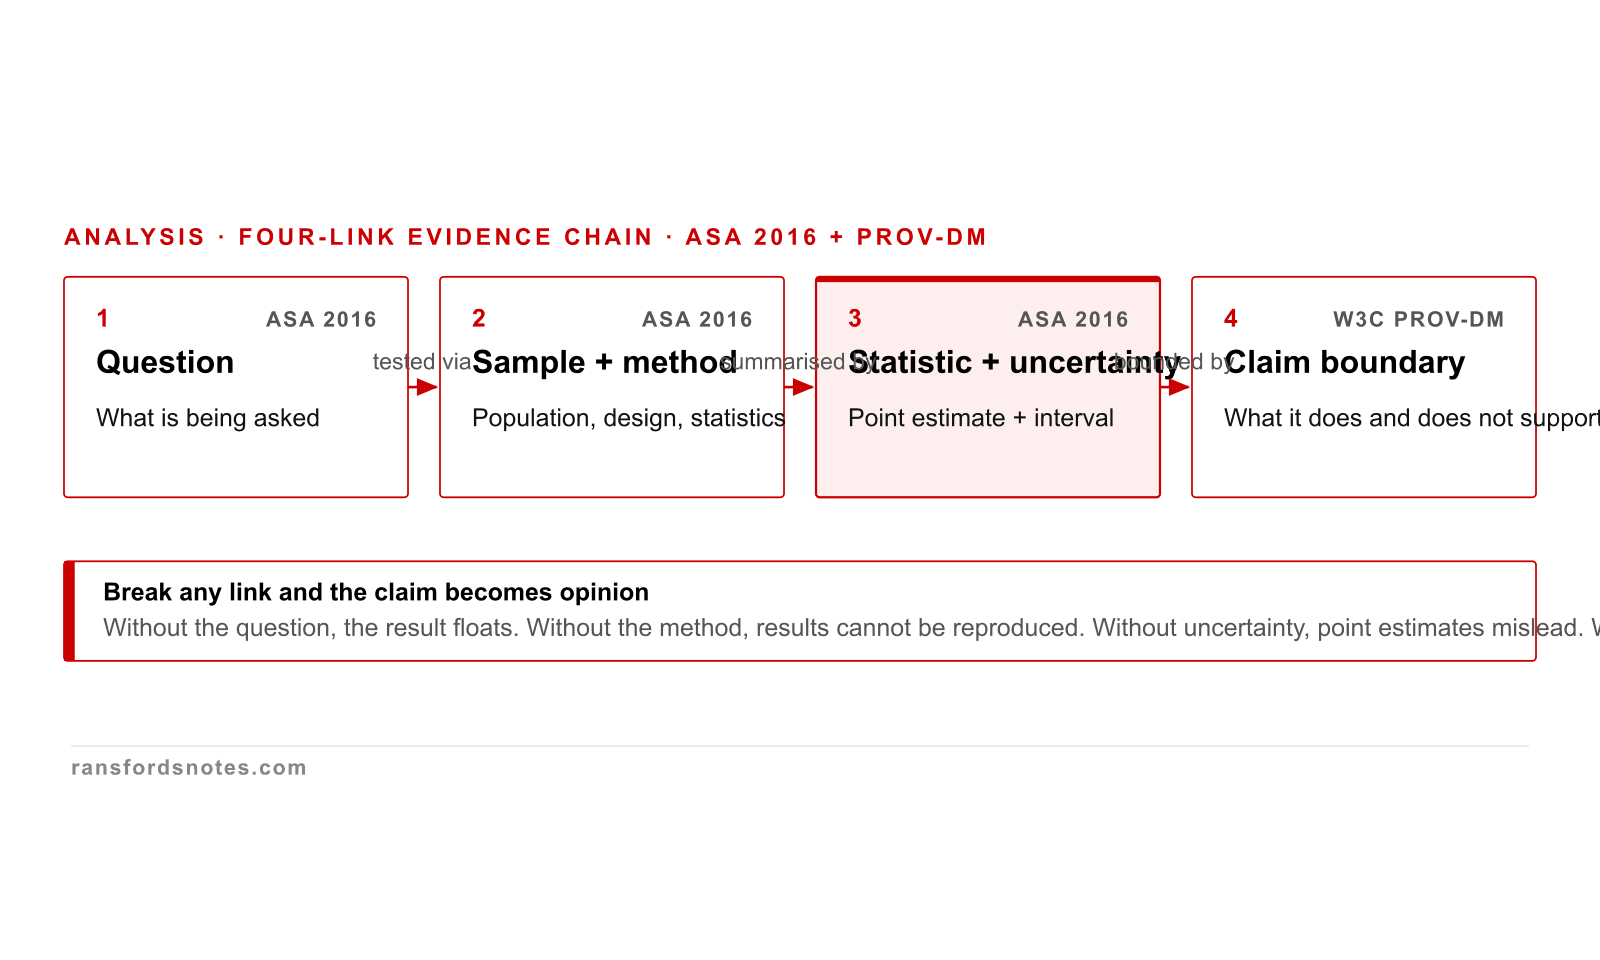
Four-link evidence chain that makes a claim defensible
Every analytical claim travels with a four-link evidence chain from question to claim boundary.
Every analytical claim travels with a four-link evidence chain: question, sample + method, statistic + uncertainty, claim boundary. Break any link and the claim becomes opinion. The ASA 2016 statement on statistical significance and W3C PROV-DM both expect this chain to be auditable.
Evidence strength ladder from anecdote to meta-analysis
Evidence strength climbs five rungs from anecdote to replicated meta-analysis.
Evidence strength climbs five rungs: anecdote, observation, controlled comparison, randomised experiment, replicated meta-analysis. The GRADE framework (Guyatt et al. 2008) is the canonical reference; each rung supports a narrower claim than the one above it.
Real-world application · 2020
Tesco reported a 30% UK panic-buying uplift during the first weeks of the Covid crisis.
In its 2020 preliminary results announcement, Tesco reported that significant panic buying in the first weeks of the crisis created about a 30% UK uplift and cleared the supply chain of some items.
The lesson is not that any one retailer had a perfect forecast. It is that descriptive analytics explains the surge after it is visible, while predictive and prescriptive analytics help teams decide which products, stores, and logistics routes need action before the next failure point.
A sales report says shelves are already empty. A forecast asks which shelves will be empty next. Which one changes the decision sooner?
Analytics turns evidence into better decisions. The four levels answer progressively more demanding questions: what happened, why did it happen, what is likely to happen, and what should we do next. The value comes from linking each output to a decision owner, a decision moment, and a measurable action.
The first distinction is the decision each type of analysis can support.
15.1 Four levels of analytics
Descriptive analytics answers "what happened?" using historical data: reports, dashboards, KPIs. It is essential, but it is not enough on its own because it usually arrives after the decision window has opened.
Diagnostic analytics answers "why did it happen?" by drilling into root causes: segmentation, cohort analysis, anomaly investigation. Revenue dropped 12% in Q3; diagnostic analysis reveals a product recall drove 80% of the decline.
Predictive analytics answers "what will happen?" using statistical models and machine learning: forecasting, classification, regression. Based on current trends, Q4 revenue is forecast at £2.1M.
Prescriptive analytics answers "what should we do?" using optimisation and simulation: resource allocation, scenario planning, decision support. To maximise Q4 revenue, shift 60% of marketing budget to digital channels.
Worked example: a weekly revenue dashboard is descriptive. A segmentation showing that the fall is concentrated in returning customers is diagnostic. A forecast that renewal revenue will miss target next month is predictive. A recommendation to prioritise save offers for a specific segment, with cost and expected retention, is prescriptive.
“All projects begin with business understanding”
CRISP-DM 1.0 - Business understanding phase
Analytics quality starts with the decision context. A technically accurate model still fails if it does not answer a business question that someone is ready to act on.
Common misconception
“Our organisation does predictive analytics because we have a machine learning model.”
A machine learning model that sits in a Jupyter notebook and is never integrated into a decision process is not predictive analytics. It is an experiment. Predictive analytics means the model's output systematically informs decisions: routing, pricing, inventory allocation, risk scoring. The gap between a working model and an operational decision tool is where most ML projects fail.
Once the decision is clear, the raw data still has to be shaped into usable signals.
15.2 Feature engineering
Feature engineering is the process of creating input variables for models from raw data. A raw dataset might contain a timestamp. Feature engineering extracts day of week, hour of day, is_weekend, days_since_last_purchase, and rolling_7_day_average. These derived features encode the patterns the model is allowed to learn.
Good feature engineering requires domain knowledge. A data scientist working on fraud detection needs to understand transaction patterns. A feature like "number of transactions in the last 15 minutes from the same card" captures a meaningful pattern that raw transaction records do not directly expose.
The governance risk is leakage. If a churn model includes a feature that is only known after the customer has already cancelled, the model will look accurate in testing and fail in production. Every feature needs a timing check: would this value really be known at the moment the decision is made?
“Change raw feature vectors into a representation that is more suitable for the downstream estimators.”
scikit-learn documentation - Preprocessing data
Feature work is not cosmetic. It changes the representation the estimator receives, which can alter whether the model can learn the intended pattern.
Common misconception
“Deep learning eliminates the need for feature engineering.”
Deep learning can learn useful representations from images, text, and audio in some domains. For tabular business data, careful feature design, leakage checks, missing-value handling, encoding, and monitoring remain central. Algorithm choice cannot rescue features that encode the wrong question.
A retail chain produces monthly sales reports showing revenue by store and product category. The reports are emailed to regional managers who review them in their next meeting. Which analytics level is this?
A data scientist builds a churn prediction model that achieves 92% accuracy in testing. Six months after deployment, the model's accuracy drops to 71%. What is the most likely cause?
A feature engineer creates 'rolling_90d_spend' from raw order data. This feature calculates the total spent by each customer in the last 90 days. Why is this more useful than raw order amounts for predicting churn?
Decision checks to carry forward
- Descriptive, diagnostic, predictive, and prescriptive analytics answer different decision questions. Choose the level from the decision need, not from the tool available.
- A model in a notebook is not analytics. Analytics means the output is tied to a decision owner, decision moment, action path, and feedback loop.
- Feature engineering turns raw observations into model inputs. Every feature needs a timing, leakage, missing-value, and meaning check.
- Prediction quality decays when behaviour, data capture, or the target relationship changes. Production analytics needs drift monitoring and a retraining route.
Standards and sources cited in this module
Business understanding, evaluation, and deployment phases
Frames analytics work around business objectives, evaluation against those objectives, and deployment into use.
Feature extraction and preprocessing
Authoritative implementation reference for transforming raw data into model-ready features and avoiding preprocessing mistakes.
AWS Well-Architected Machine Learning Lens
Monitoring
Defines production monitoring for data quality, model quality, bias drift, and feature attribution drift.
Data Science and Analytics knowledge area
Industry framework for analytics capability and maturity assessment.
Tesco PLC Preliminary Results Announcement 2020
Covid-19 trading update
Source for the reported 30% UK panic-buying uplift used in the opening case.
Module 15 of 26 · Applied Data