Inference and experiments
By the end of this module you will be able to:
- Design a valid A/B test with proper controls
- Explain p-values and their limitations
- Describe common experimental pitfalls
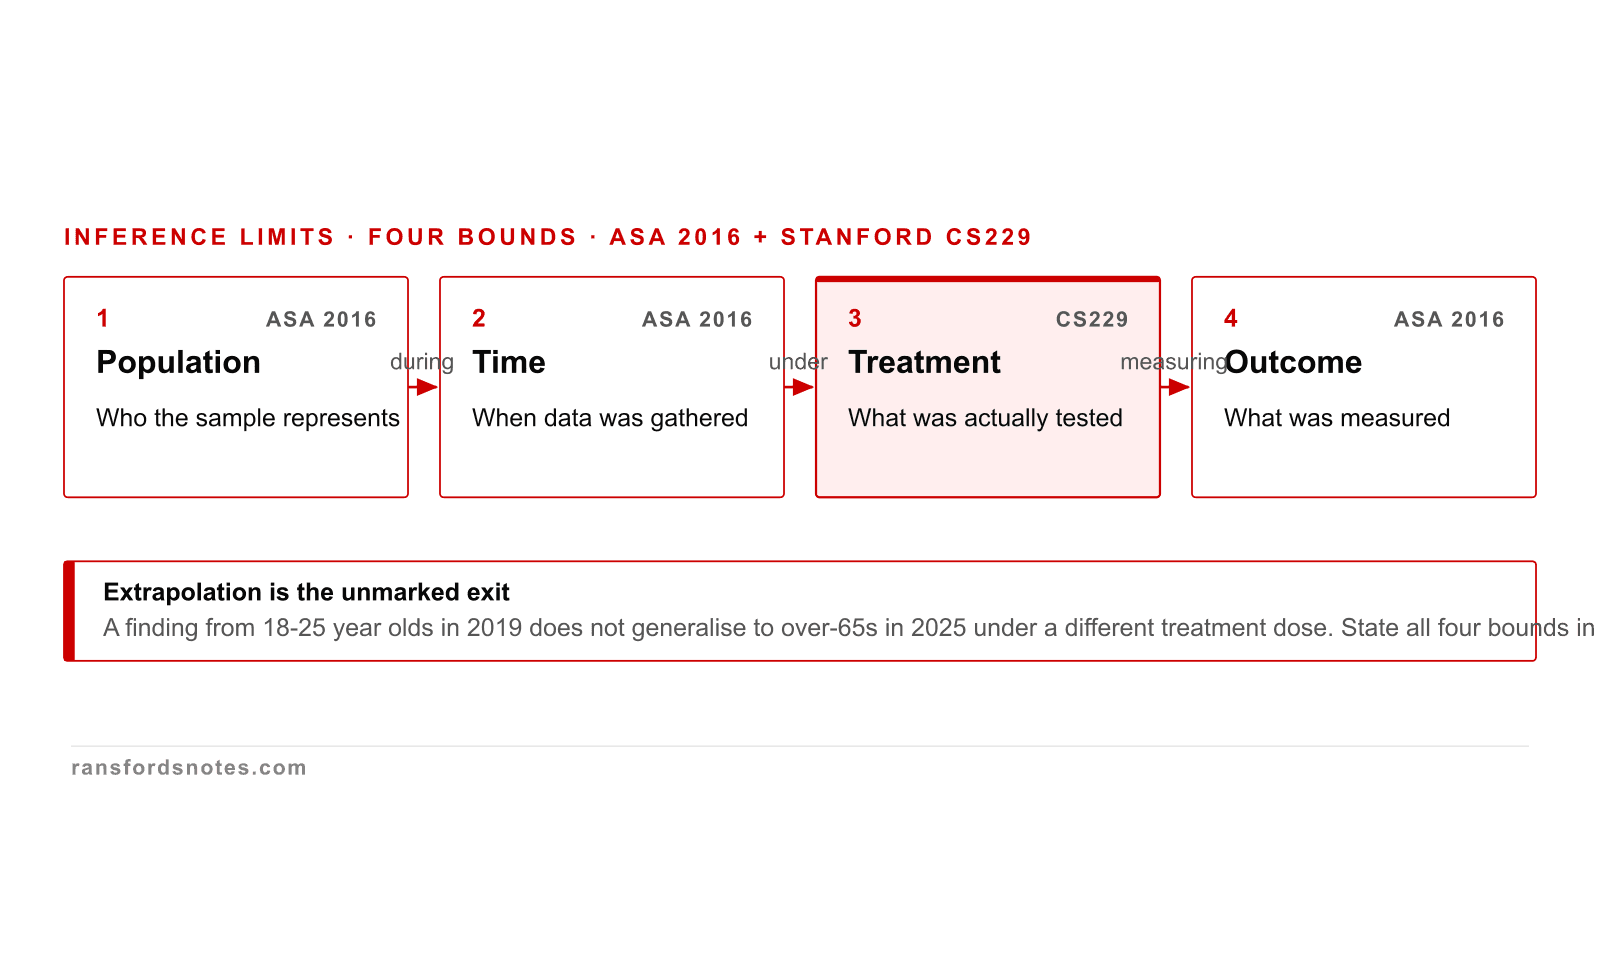
Inference scope bounded on population, time, treatment, outcome
Every inference is bounded on four axes: population, time, treatment, outcome.
Every inference is bounded on four axes: population (who the sample represents), time (when the data was gathered), treatment (what was actually tested), outcome (what was measured). Stretching any axis beyond the study is extrapolation. The ASA 2016 statement makes this explicit; bounded claims survive replication, unbounded claims do not.
Four design choices that defend the causal claim
Four design choices defend the causal claim: randomisation, blocking, replication, blinding.
Experiment design is four choices: randomisation, blocking, replication, blinding. Each closes a specific bias channel. Fisher (1935) named the first three; CONSORT 2010 added blinding as a reporting requirement for trials. Designs that skip any of the four cannot defend the causal claim.
Reading a p-value without making the common four mistakes
A p-value is the probability of seeing the data given the null hypothesis is true, not a verdict.
A p-value is the probability of seeing the data given the null hypothesis is true. It is not the probability the hypothesis is true; it is not the size of the effect; it is not a binary verdict. The ASA 2016 statement on statistical significance names six principles and warns against bright-line thresholds.
Real-world experiment · 2012
Obama's campaign showed why test design beats executive preference.
During the 2012 US presidential campaign, digital teams tested email subject lines, donation prompts, and landing pages rather than relying on senior preference. The widely reported lesson was not that one phrase always wins. It was that small changes can have material effects only when the comparison is randomised and measured.
The previous module covered how to interpret statistical patterns. This module covers how to create decision-grade evidence deliberately through experiments, and why a short read can introduce the discipline but cannot replace a full statistics or experimentation programme.
The winning subject line was 'Hey.' It outperformed polished alternatives by 49%. Would you have predicted that?
Experimentation is how we move from correlation to causation. An A/B test (randomised controlled trial in a business context) isolates the effect of a single variable by comparing a treatment group to a control group. Everything else is held constant. The difference in outcomes can be attributed to the variable you changed. The formal mathematics appears later; here the priority is the design discipline that keeps decisions honest.
A credible experiment starts before any data is collected.
17.1 Designing a valid A/B test
An A/B test is a randomised comparison between a control and a treatment. It is powerful because randomisation makes the groups comparable before the change is applied. Five requirements make the result decision-grade:
- Random assignment: participants are randomly assigned to treatment or control. Non-random assignment introduces selection bias.
- Single variable: only one thing differs between groups. Changing the headline AND the button colour simultaneously means you cannot attribute the effect to either one.
- Adequate sample size: small samples produce noisy results. A power calculation before the test determines the minimum sample needed to detect an effect that is large enough to matter.
- Pre-specified hypothesis: decide what you are measuring and what counts as success before running the test. Changing the metric after seeing results is p-hacking.
- Sufficient duration: run the test long enough to capture natural variation (weekday vs weekend, payday effects, seasonal patterns). Stopping early because one variant looks good is a common error.
Worked example: if checkout conversion is 3.2% and the smallest useful improvement is a 15% relative lift, the target is 3.68%. A test with too few visitors may miss that improvement or overreact to noise. The leadership implication is direct: launch decisions should be tied to minimum detectable effect, sample size, and guardrail metrics before the experiment starts.
“Proper inference requires full reporting and transparency.”
American Statistical Association (2016) - ASA Statement on Statistical Significance and P-Values, Principle 4
A test plan, primary metric, sample-size calculation, exclusions, and stopping rule need to be visible before analysis. Without those controls, a positive result may be a reporting artefact rather than evidence.
Common misconception
“We ran the test for two days and variant B is winning. Let us launch it.”
Two days is rarely long enough to capture natural variation. Weekend vs weekday behaviour, payday effects, and seasonal patterns can all produce misleading short-term results. A power calculation before the test determines the minimum duration. Stopping early based on interim results inflates the false positive rate.
The result is only useful if the uncertainty is interpreted correctly.
17.2 Understanding p-values
A p-value answers a narrow question: if there were no real difference between groups, how unusual would this result be under the statistical model? A p-value of 0.03 means the observed result, or a more extreme one, would occur about 3% of the time if the null hypothesis and model assumptions were true.
The conventional threshold is p < 0.05, but this is arbitrary, not sacred. A p-value of 0.049 is not meaningfully different from 0.051. The American Statistical Association published a statement in 2016 warning against the binary interpretation of p-values and the practice of p-hacking (running many tests and reporting only the significant ones).
Report the effect size and confidence interval alongside the p-value. A statistically clear result can still be commercially irrelevant if the effect is tiny. A commercially large effect can still be uncertain if the interval is wide. The executive question is not "is it significant?" It is "is the effect large enough, reliable enough, and safe enough to act on?"
“Scientific conclusions and business or policy decisions should not be based only on whether a p-value passes a specific threshold.”
American Statistical Association (2016) - ASA Statement on Statistical Significance and P-Values, Principle 3
The ASA statement was unprecedented: a professional body publicly correcting widespread misuse of its own methodology. It emphasised that p-values do not measure the probability that the hypothesis is true, and that context, study design, and effect size all matter alongside p-values.
Common misconception
“A p-value of 0.01 means there is a 1% chance the result is wrong.”
A p-value of 0.01 means: if there were no real effect, there is a 1% chance of observing a result this extreme. It does not tell you the probability that the effect is real. That requires Bayesian analysis, which incorporates prior knowledge. The distinction matters: a p-value of 0.01 from a poorly designed experiment with a tiny sample is much less convincing than a p-value of 0.04 from a well-powered, pre-registered study.
A product team runs an A/B test on two homepage designs. After three days, Design B has a 12% higher click-through rate than Design A. The team has 4,000 visitors in each group. The product manager wants to launch Design B immediately. What is the problem?
A study reports a p-value of 0.04. The researcher says this means there is a 96% probability that the treatment works. What is the error?
A marketing team tests five different email subject lines simultaneously. One achieves p = 0.03. They declare it the winner. What experimental pitfall is this?
Experiment checks to carry forward
- A valid A/B test requires random assignment, one intended change, a useful primary metric, an adequate sample size, and a stopping rule set before launch.
- P-values describe data compatibility with a null model. They do not measure the probability that a hypothesis is true or that a decision is safe.
- Effect size, confidence interval, guardrail metrics, and study design matter alongside the p-value. Binary threshold thinking is not enough for business or policy decisions.
- Multiple variants increase the chance of a false positive. Adjust the analysis plan or treat the result as exploratory until confirmed.
Standards and sources cited in this module
American Statistical Association (2016), 'ASA Statement on Statistical Significance and P-Values'
Full statement
Corrects widespread p-value misinterpretation. Principle 3 cited directly in Section 17.2.
Kohavi, R., Tang, D., and Xu, Y. (2020). Trustworthy Online Controlled Experiments
Chapters 1-5
Modern reference for A/B testing at scale. Covers power analysis, early stopping, guardrails, and multiple comparisons.
Optimizely, 'Obama's $60 Million Experiment' (2013)
Case study
Secondary report behind the campaign testing example. Used as an illustration, not as a universal rule about subject-line wording.
Evaluation and deployment phases
Reinforces that analytics work must be evaluated against business objectives before deployment.
Data Science and Analytics knowledge area
Framework for experimental analytics within data management practice.
Module 17 of 26 · Applied Data