What data is
Raw facts, symbols, and signals: what data actually is before it becomes anything useful, and why the distinction between data, information, and knowledge matters for everyone who works with it.
By the end of this module you will be able to:
- Distinguish data from information and knowledge using concrete examples
- Classify a dataset as structured, unstructured, or semi-structured
- Explain why data volume estimates need a source, date, and scope before they are used
How observation becomes information that survives the journey
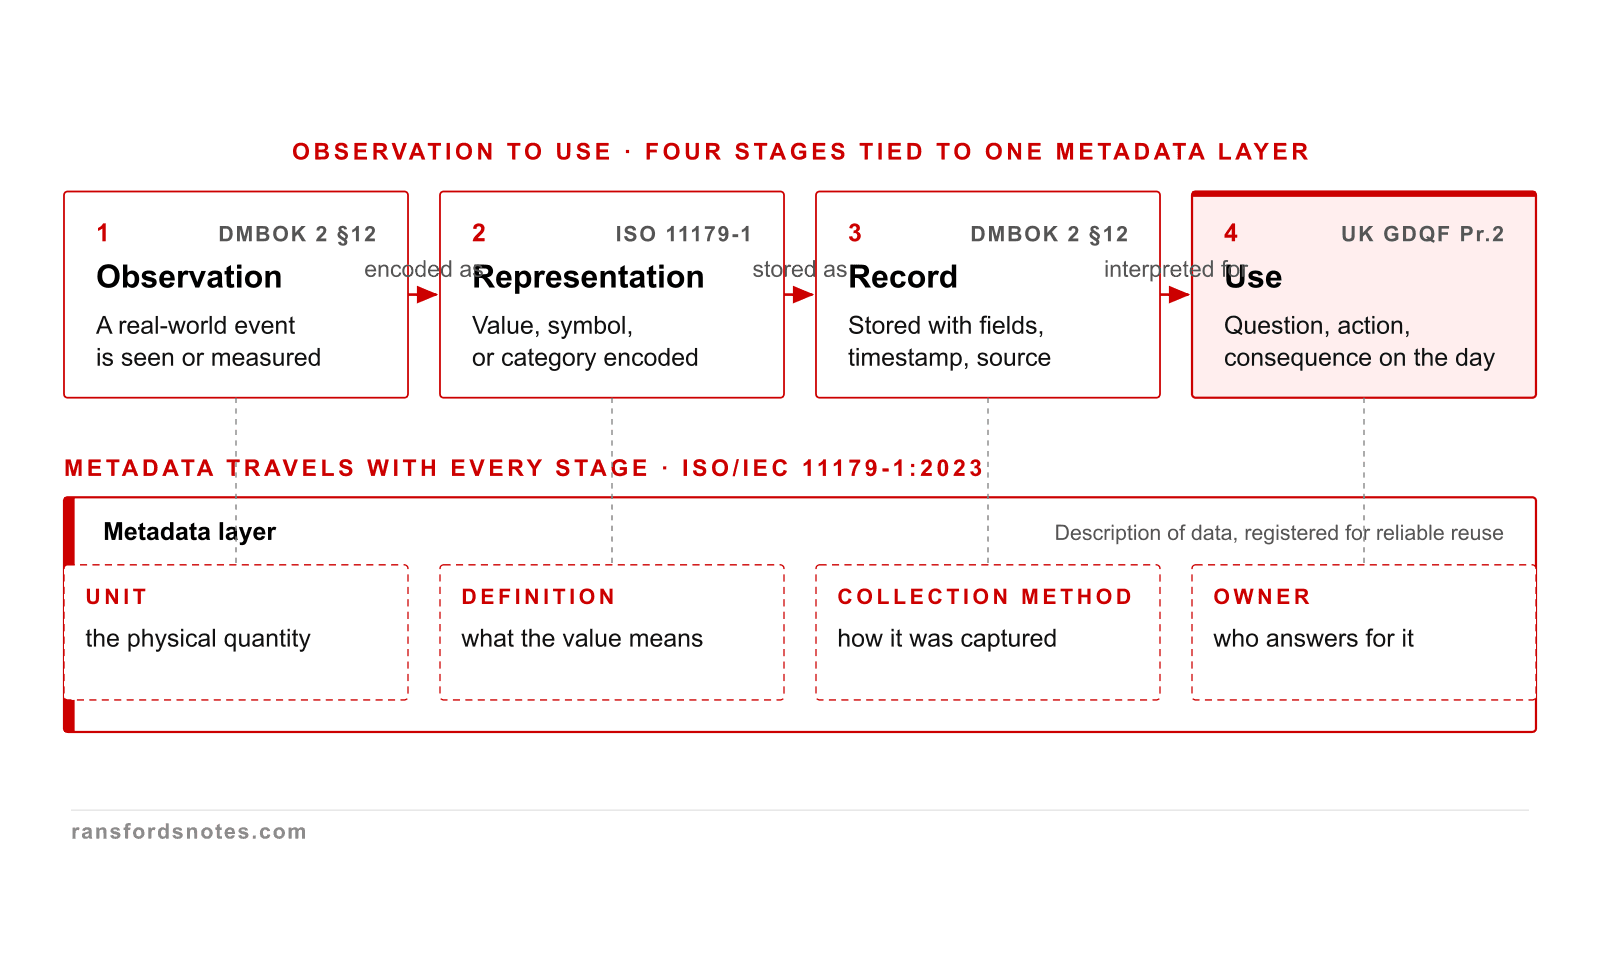
Raw observations only become useful when representation, record, and decision use travel together with their metadata.
Data only becomes useful when representation, record, and decision use travel together with the metadata that preserves their meaning. ISO/IEC 11179-1:2023 frames metadata as the layer that makes that survival possible.
Context turns a value into a usable data point
The same value 37.2 reads as fever, temperature, or percent depending on what metadata is wrapped around it.
Meaning is added by wrapping a value in metadata, not by changing the value. The same 37.2 reads as fever, temperature, or percent depending on Unit, Definition, Source, and Decision context. ISO/IEC 11179-1:2023 names those wrappers the data element definition, value domain, and conceptual domain.
Where context is dropped: four named failure signatures
Each stage of the observation-to-use journey has a meaning-preserving path and a named failure signature.
Every stage of the observation-to-use journey has both a meaning-preserving path and a failure signature. The UK Government Data Quality Framework Principles 1 and 5 require teams to document both so consumers know when the data is fit to use.
Think about it
The National Health Service holds 1.6 billion data items - but cannot answer a simple question without a data standards programme.
In 2022, NHS England published its Data Strategy stating that the health service holds approximately 1.6 billion data items across clinical records, imaging, prescriptions, and operational systems. Yet a GP in Manchester and a consultant in London could look at the same patient record and see different information, because the same field - say, a diagnosis code - was stored using different classification systems across different trusts.
The problem was not volume. The NHS had enormous quantities of data. The problem was that raw data, without shared definitions, agreed formats, and consistent standards, is not information. It is noise at scale. The NHS Data Standards Authority was created in 2020 specifically to address this: to transform 1.6 billion data items from a collection of local facts into a national information asset.
That distinction between data and information is what this module is about.
Defining data
Data is a collection of raw facts represented as symbols, numbers, text, images, or signals. The word comes from the Latin datum, meaning "something given." In computing and information science, data is the lowest layer of recorded observation before any processing or interpretation has taken place.
W3C describes data as facts that can be recorded and have implicit meaning. That framing is useful because it separates the record from the interpretation. A temperature sensor value, a diagnosis code, or a payment timestamp can be recorded; each still needs metadata, context, and a purpose before it can support a decision.
Data can be a number (37.2), a word ("confirmed"), a pixel value (RGB 255, 0, 128), a sensor voltage reading, or a GPS coordinate pair. What makes something data is not its form but its status: it is a raw, recorded observation. It has no inherent meaning on its own; meaning is assigned through context and interpretation.
The distinction between data, information, and knowledge is often treated as academic, but it has real consequences for data management practice. Organisations routinely store enormous volumes of data while believing they have information. A database of 50 million customer records is data. Only when it has been cleaned, contextualised, and made queryable for a specific purpose does it approach information. Confusing the two leads to overinvestment in storage and underinvestment in processing.
A recorded observation becomes easier or harder to use depending on its shape. The next distinction is whether the data arrives in a strict schema, loose documents, or a format that sits between the two.
Structured, unstructured, and semi-structured data
Not all data has the same form. The distinction between these three categories shapes how data is stored, processed, and analysed.
- Structured data conforms to a predefined schema: rows, columns, and data types are fixed in advance. Relational databases are the canonical storage format. Examples include sales transactions, employee records, and sensor logs with fixed fields.
- Unstructured data has no predefined schema. It cannot be directly queried with standard database tools without preprocessing. Examples include email bodies, social media posts, audio recordings, CCTV footage, and freeform clinical notes.
- Semi-structured data has some organisational properties (tags, markers, hierarchy) but does not conform to a rigid relational schema. JSON and XML files are the most common examples. A product catalogue in JSON has consistent key names but variable numbers of attributes per product.
Published estimates of global data volume change quickly and often sit behind commercial research reports. IDC's Global DataSphere forecast series is the recognised market source, but an exact zettabyte figure should always be quoted with the forecast year, publication date, and definition of what is counted: created, captured, replicated, stored, or consumed. The practical lesson is stable: organisations create far more text, image, video, log, and sensor data than they can interpret unless they invest in structure, metadata, and standards.
Those categories show up in ordinary systems every day. The same service may produce table rows, JSON payloads, log files, images, and free text from one user session.
“Data is a representation of facts, concepts, or instructions in a formalised manner suitable for communication, interpretation, or processing by human beings or by automatic means.”
ISO/IEC 11179-1:2023, Data element concepts - Section 3.1, Data
Everyday data sources
Data is generated constantly by ordinary systems and activities. Recognising data sources is a practical skill for anyone working with information systems:
- Form submissions: a user filling in a name and postcode on a government service creates two structured data fields.
- Sensor readings: a smart electricity meter sends consumption readings every 30 minutes; each reading is a timestamped numeric value.
- GPS coordinates: location services record latitude, longitude, altitude, and timestamp. A single taxi trip may generate thousands of GPS pings.
- Web server logs: every HTTP request to a website generates a log entry containing IP address, timestamp, requested URL, and response code.
- Images and video: a CCTV camera continuously generates pixel arrays. Each frame is a matrix of numeric colour values. Without additional processing (object detection), the raw pixel data has no semantic content.
A hospital's patient records database contains 50 million rows, each with a patient ID, admission date, diagnosis code, and treatment code. The diagnosis codes use three different coding systems across different hospital sites. Is this data or information?
Common misconception
“A large database of records means an organisation has useful information.”
Volume does not equal value. A database of 50 million customer records is data, not information. Only when it has been cleaned, contextualised, documented, and made queryable for a specific purpose does it approach information. Raw data without cleaning, documentation, and context is expensive to store and difficult to use. Overinvesting in storage while underinvesting in processing and documentation is one of the most common data strategy errors.
Core distinctions
- Data is a raw, uninterpreted symbol or signal. It only becomes information when context is applied, and knowledge when that information is interpreted and understood.
- Structured data conforms to a fixed schema (relational tables); unstructured data has no schema (documents, images, audio); semi-structured data has partial organisation through tags or hierarchy (JSON, XML).
- Global data volume claims should be treated as dated forecasts. Quote the forecast year, publication date, and scope before using a zettabyte figure in strategy or architecture work.
- Volume does not imply value. Uncleaned, undocumented data imposes storage cost without delivering analytical benefit. The most common data strategy error is overinvesting in storage and underinvesting in processing.
You can now distinguish data from information and classify datasets by structure. The next module examines the DIKW hierarchy: a framework for understanding how raw data transforms into actionable wisdom through context, interpretation, and judgement. The question shifts from "what is data?" to "what do we do with it?"
Standards and sources cited in this module
ISO/IEC 11179-1:2023: Information technology - Metadata registries
Data element concepts: formal definitions of data, information, and their relationships.
W3C Data on the Web Best Practices (DWBP)
Section 2: Data concepts including structured/unstructured distinctions and machine-readability.
IDC Global DataSphere forecast series
Current forecast series for global data creation and replication. Exact zettabyte figures should be date-stamped before use.
UK Met Office: How we create a forecast
Atmospheric data ingestion volumes and the processing chain from raw sensor data to public forecast.