Data quality and meaning
By the end of this module you will be able to:
- Define and distinguish the six ISO 8000-8 data quality dimensions
- Apply a data quality dimension to assess a described dataset scenario
- Explain the difference between data quality and data fitness for purpose
- Describe a master data management approach for a given quality problem
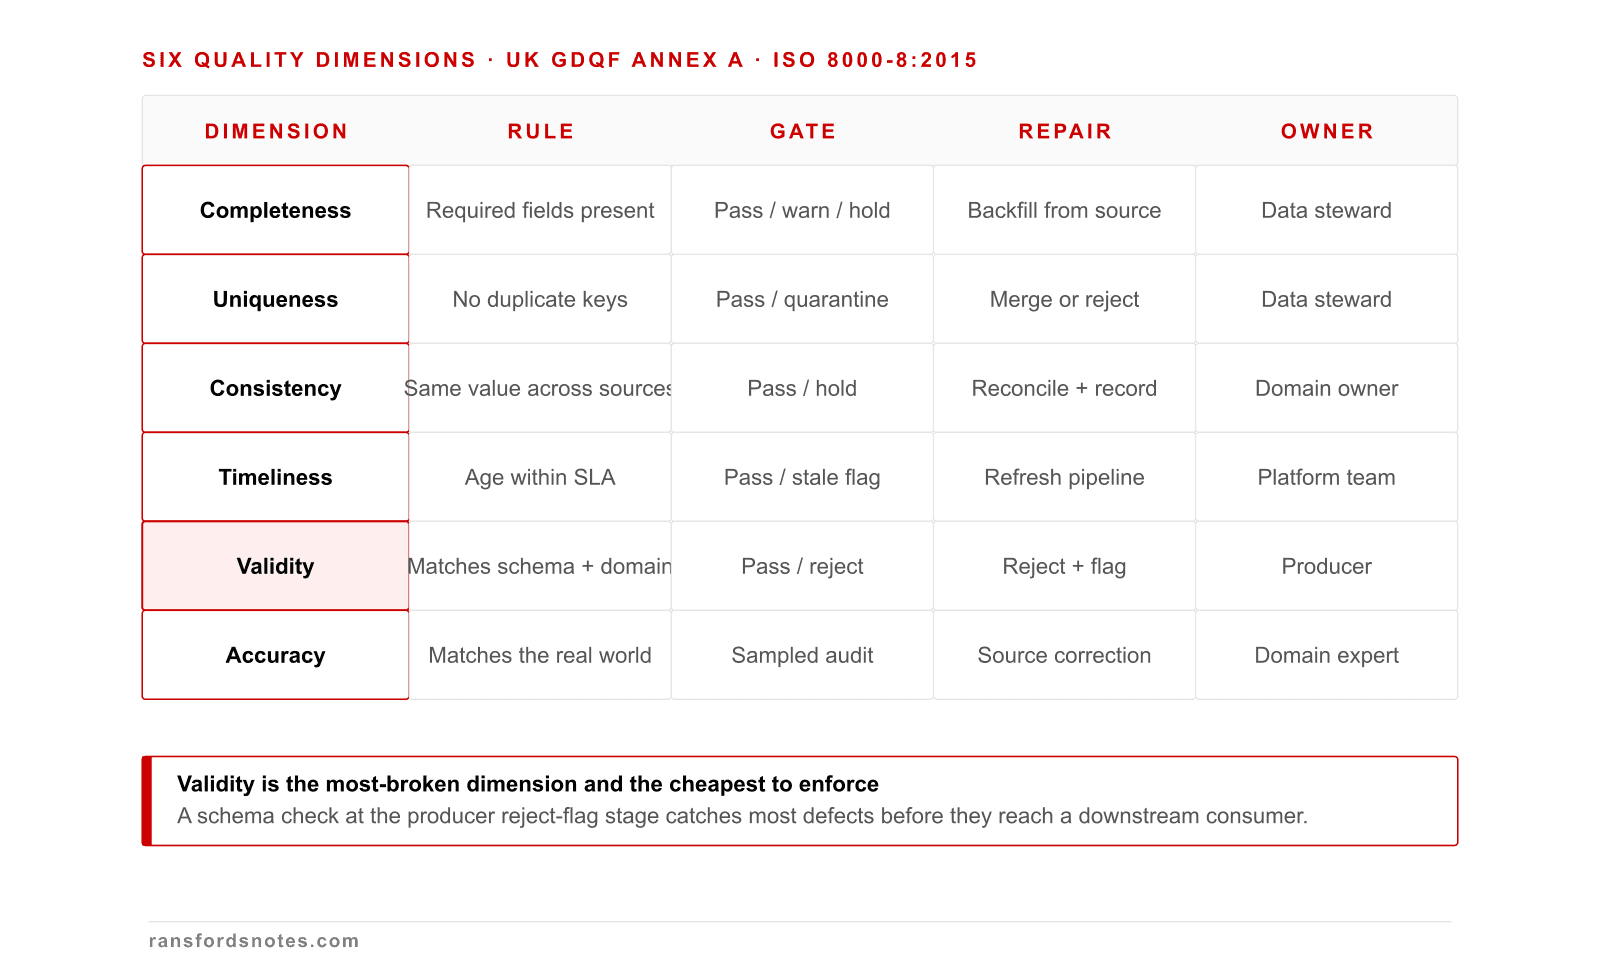
Six quality dimensions and the rule, gate, repair, owner for each
Quality is six measurable dimensions, each with a rule, a gate, a repair action, and a named owner.
Quality is a matrix of six dimensions, each with a measurable rule, a gate, a repair, and a named owner. The UK Government Data Quality Framework Annex A defines the six dimensions; ISO 8000-8:2015 defines how to measure them.
Anatomy of a useful data quality rule
A useful data quality rule has five named parts: field, expectation, threshold, action, and evidence.
A quality rule has five parts: field, expectation, threshold, action, and evidence. Drop any one and the rule cannot run or cannot be audited. DAMA-DMBOK 2 Chapter 13 and UK GDQF Annex A both spec this anatomy.
Quality remediation as a five-step learning loop
Quality remediation is a five-step learning loop: detect, triage, repair, verify, learn.
Quality remediation is a five-step loop: detect, triage, repair, verify, learn. The learn step feeds the next detection rule. Dropping it turns quality work into a treadmill of repeated defects. DAMA-DMBOK 2 Chapter 13 names the same shape.
Real-world incident · 2019
Duplicate records inflated hospital death counts by 552.
In 2019, NHS England published hospital mortality statistics that incorrectly attributed 552 additional deaths to a particular hospital trust. The cause was duplicate patient records in the underlying data pipeline: patients treated at multiple hospitals had separate records that were not de-duplicated before analysis.
The trust faced reputational damage before the error was identified and corrected. Data quality is not an abstract concept, and the costs of poor quality extend well beyond spreadsheet errors.
The previous module covered how to present data clearly. This module covers how to ensure the data is worth presenting in the first place.
No one deliberately falsified data. Yet a hospital trust faced reputational damage because of duplicate records. Is bad data quality always someone's fault?
The NHS case illustrates a principle that runs through every data role: the quality of decisions cannot exceed the quality of the data they rely on. Gartner estimated in 2018 that organisations believe poor data quality costs them an average of $12.9 million per year. The actual costs include wasted effort, incorrect decisions, compliance failures, and reputational damage.
With the learning outcomes established, this module begins by examining what data quality means in depth.
8.1 What data quality means
Data quality is the degree to which data is fit for the intended use of its consumers. The critical phrase is "fit for purpose." A dataset with 5% address errors may be acceptable for postal marketing but unacceptable for regulatory compliance reporting.
ISO 8000-8:2015 and the DAMA-DMBOK (Data Management Body of Knowledge) both define data quality as multidimensional: no single measure captures all aspects. The standard framework uses accuracy, completeness, consistency, timeliness, validity, and uniqueness.
“Data quality: the degree to which a set of inherent characteristics of data fulfils requirements.”
ISO 8000-8:2015, Data quality - Clause 3.1, definition of data quality
The ISO definition deliberately ties quality to requirements. A dataset is not 'high quality' or 'low quality' in the abstract. Quality is always measured against a stated purpose. This is why the same dataset can be adequate for one team and inadequate for another.
With an understanding of what data quality means in place, the discussion can now turn to the six dimensions of data quality, which builds directly on these foundations.
8.2 The six dimensions of data quality
- Accuracy: the degree to which data correctly reflects the real-world entity or event it represents. A customer record with a misspelled surname is inaccurate. An inventory record showing 50 units when 47 are physically present is inaccurate. Accuracy can only be assessed by reference to a ground truth.
- Completeness: the degree to which required data values are present. A patient record with no date of birth is incomplete. Measured as the proportion of non-null required fields. 100% completeness is not always achievable: some data is genuinely unknown at collection time.
- Consistency: the degree to which data values agree across related records or systems. A customer marked "Active" in the CRM but "Closed" in the billing system is an inconsistency. These failures commonly arise from multiple systems holding overlapping data without synchronisation.
- Timeliness: the degree to which data is current and available when needed. A postcode file updated annually may be timely for annual reporting but stale for a logistics system routing same-day deliveries.
- Validity: the degree to which data conforms to defined rules, formats, or ranges. A date of birth of "31/02/2001" is invalid (February has no 31st day). Validity is testable against schema constraints.
- Uniqueness: the degree to which records are not duplicated. The NHS mortality incident was a uniqueness failure: the same patients appeared multiple times, inflating counts.
Common misconception
“If the data is complete, it must be high quality.”
Completeness is just one quality dimension. A dataset can be 100% complete (no empty fields) while containing inaccurate values, invalid formats, and duplicate records. A CRM with every field filled but 23% duplicate customers has a completeness score of 100% and a severe uniqueness problem. All quality dimensions must be assessed independently.
With an understanding of each quality dimension in place, the discussion can now turn to measuring data quality in practice, which builds directly on these foundations.
8.3 Measuring data quality in practice
Data quality measurement begins with profiling: automated analysis that characterises a dataset's contents. A profiling exercise typically measures completeness (null counts per field), validity (format and constraint failures), uniqueness (duplicate record counts), and pattern conformance (values matching expected patterns such as postcodes or phone numbers).
Tools such as Great Expectations (open source), Soda Core, and dbt tests automate profiling as part of data pipeline runs. The output is a data quality report that flags violations against defined thresholds.
“Data quality is not a project. It is a programme: an ongoing commitment to measuring, monitoring, and improving the quality of data assets.”
DAMA-DMBOK2 (2017) - Chapter 13, Data Quality Management
DAMA's framing as a programme (not a project) addresses the most common failure mode: organisations that run a one-time cleansing exercise, declare victory, and watch quality degrade within months because the processes creating poor data were never fixed.
With an understanding of measuring data quality in practice in place, the discussion can now turn to data quality versus fitness for purpose, which builds directly on these foundations.
8.4 Data quality versus fitness for purpose
A dataset can score well on all quality dimensions and still be unfit for a specific purpose. A marketing database with complete, accurate, consistent, timely, valid, and unique records may be entirely unfit for clinical research because it lacks medical context, provenance documentation, and consent records.
Quality assessments should always begin with a use case definition: what decisions will this data support, and what threshold does each dimension need to meet for those decisions to be reliable?
Common misconception
“Data quality is IT's problem to fix.”
Data quality failures originate in business processes: manual data entry without validation, systems that allow free-text where a lookup table should be used, and workflows that create duplicate records when updates should be applied. IT can build validation rules and profiling tools, but the processes that generate poor data belong to business teams. Fixing quality requires business process change, not just technical remediation.
With an understanding of data quality versus fitness for purpose in place, the discussion can now turn to master data management, which builds directly on these foundations.
8.5 Master data management
Master data management (MDM) is the set of processes, governance, policies, and tools used to maintain a single, authoritative, and consistent version of key shared data entities: customers, products, employees, and locations.
In practice, MDM involves four steps:
- Identifying the master data domains (customer, product, supplier, location)
- Designating a system of record for each domain: the authoritative source
- Implementing matching and merging rules to de-duplicate records across systems
- Establishing governance to control who can create, update, or retire master records
A UK financial services firm audited its CRM in 2021 and found that 23% of customer records were duplicates, created when customers changed contact details and were re-registered rather than updated. The downstream effects included wasted marketing spend, incorrect churn metrics, and an inflated customer base that affected investment decisions. The MDM programme to resolve this took eight months.
A retailer's database shows a product weight of 2.5kg. The physical product weighs 1.8kg. The record also has a null value in the 'supplier_code' field, which is marked as required. Which quality dimensions are affected?
A local authority uses address data from its housing register, last updated 18 months ago, to send council tax reminder letters. A high proportion of letters are returned as undeliverable. Which quality dimension is the primary issue?
Your organisation runs a one-time data cleansing project that corrects 100,000 records. Six months later, quality metrics show degradation returning to pre-cleansing levels. What went wrong?
Key takeaways
- ISO 8000-8 defines data quality through accuracy, completeness, consistency, timeliness, validity, and uniqueness. Each must be measured independently.
- Quality is always relative to intended use. A dataset can score well on every dimension and still be unfit for a specific purpose if it lacks the context, provenance, or consent records that purpose requires.
- Gartner estimated poor data quality costs organisations an average of $12.9 million per year (2018). Costs include wasted operations, incorrect decisions, compliance failures, and reputational harm.
- Master data management (MDM) prevents conflicting versions of key entities. It requires governance and ongoing process change, not a one-time cleansing exercise.
- DAMA-DMBOK frames data quality as a programme, not a project. Fixing processes that create poor data is more important than cleansing the data they have already produced.
Standards and sources cited in this module
ISO 8000-8:2015, Data quality
Clause 3.1, data quality dimensions
Authoritative definition of the six quality dimensions used throughout this module.
ISO/IEC 25012:2008, Data quality model
Full standard
Broader quality framework distinguishing inherent quality (accuracy, completeness) from system-dependent quality (accessibility, recoverability).
DAMA-DMBOK2 (2017)
Chapter 13, Data Quality Management
Industry standard guidance on quality measurement, profiling, and the 'programme not project' principle.
Gartner Research (2018), 'How to Stop Data Quality Undermining Your Business'
Research note
Source for the $12.9 million average annual cost estimate of poor data quality.
NHS England, mortality statistics correction notice (2019)
Public statement
Opening case study: 552 incorrectly attributed deaths caused by duplicate patient records in the data pipeline.
Module 8 of 26 · Data Foundations