Loading lesson...
Loading lesson...
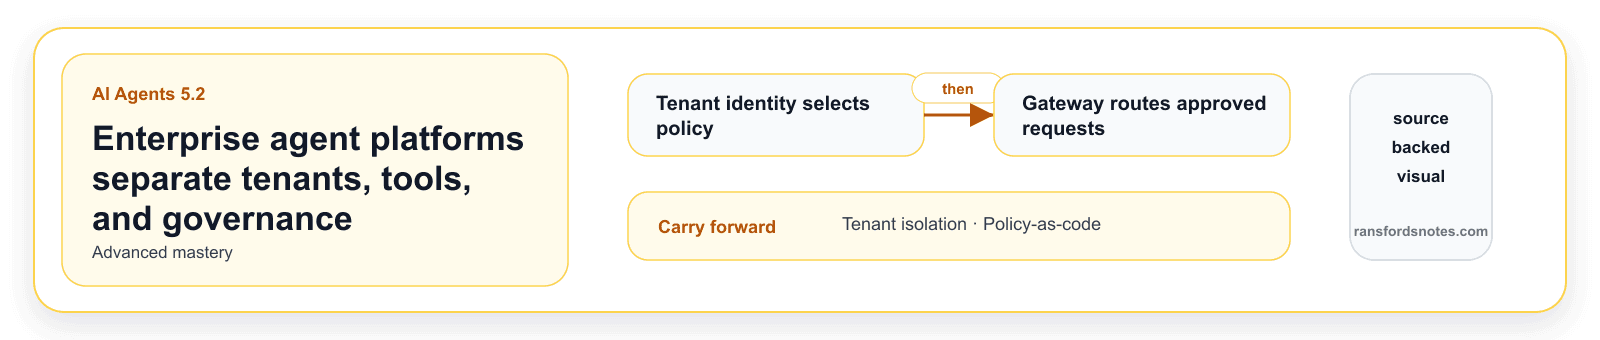
Shared services need identity, policy, observability, cost controls, and lifecycle governance.
Five layers, one platform: identity, gateway, tools, observability, governance. ISO/IEC 42001 is the management contract; TOGAF 10 ADM is the build sequence.
Real-world deployment · January 2024
In January 2024, JPMorgan Chase published research on DocLLM, a large language model designed specifically for enterprise document understanding. The bank processes an enormous volume of financial documents: contracts, loan applications, regulatory filings, and trade confirmations. These documents contain both text and structural layout information that standard LLMs discard.
DocLLM extended transformer attention to capture spatial relationships between text blocks on a page, enabling significantly better extraction accuracy on documents such as insurance forms, financial tables, and multi-column regulatory filings. The research was notable not just for the model design but for what it revealed about enterprise AI requirements: a bank cannot send all document data to an external API, cannot accept non-deterministic model versions, and cannot tolerate processing failures without audit trails.
Microsoft faced similar challenges when deploying Copilot for Microsoft 365 to enterprise customers. The architecture had to isolate each tenant's data, enforce regional data residency for customers subject to GDPR (General Data Protection Regulation) and similar laws, and provide complete audit logs of every AI-assisted action. A prototype agent handles none of these concerns. An enterprise deployment cannot ignore any of them.
When a single bank processes more documents per day than most companies process in a year, what does AI infrastructure actually need to look like?
A fine-tuned model needs a system around it. This module covers multi-tenant agent platforms, compliance requirements, cost management at scale, and the architectural decisions that separate a prototype from an enterprise deployment.
With the learning outcomes established, this module begins by examining why enterprise ai is architecturally different in depth.
A prototype agent running on a developer's laptop has different requirements from one processing 100,000 customer queries per day across four time zones. Enterprise scale introduces concerns that do not exist at prototype scale: queue depth, tail latency under load, cost per query at volume, audit trail completeness, model version control across environments, and the organisational complexity of multiple teams sharing the same AI infrastructure.
The most important architectural shift is moving from synchronous to asynchronous processing. In a synchronous architecture, every caller waits for their agent to complete. When traffic spikes, latency increases linearly. When the LLM API is slow, every user waits. An async queue architecture decouples request submission from processing entirely: callers submit a task and receive a job ID, workers process from the queue independently, and results are retrieved when ready.
The difference between a prototype and a production enterprise agent system is rarely the AI capability. It is the surrounding infrastructure: queueing, observability, cost controls, guardrails, and compliance.
With an understanding of why enterprise ai is architecturally different in place, the discussion can now turn to the async queue pattern, which builds directly on these foundations.
The async queue pattern uses three components. An API gateway receives incoming requests, applies rate limiting and authentication, and places tasks onto a message queue. A pool of stateless worker processes reads from the queue, one task per worker at a time. Workers call the LLM API, execute tools, and write results to a storage layer. The queue is typically backed by Redis Streams, AWS SQS (Simple Queue Service), or RabbitMQ.
Workers are stateless by design: they hold no in-memory state between tasks. This makes horizontal scaling trivial. When queue depth grows, you start more workers. When it shrinks, you stop them. In Kubernetes (k8s), the container orchestration platform used by most cloud deployments, a Horizontal Pod Autoscaler (HPA) can trigger automatically based on queue depth metrics, scaling from 2 workers to 20 within seconds.
Queue-based architectures also provide natural backpressure. If the LLM API is throttled, workers slow down and the queue grows, but callers are not directly affected. If a worker crashes mid-task, the message remains unacknowledged and is re-delivered to another worker. This is fault tolerance that synchronous architectures cannot provide without complex retry logic scattered across the calling code.
“Observability is the ability to understand the internal state of a system from its external outputs.”
ISO/IEC 42001:2023 - Section 9.1: Monitoring, measurement, analysis and evaluation
For agent systems, observability means being able to answer: what did this agent do, in what order, with what inputs and outputs, how long did each step take, and how much did it cost? Without instrumentation built into the agent loop, these questions cannot be answered after the fact.
With an understanding of the async queue pattern in place, the discussion can now turn to observability: distributed tracing and metrics, which builds directly on these foundations.
Agent systems are distributed systems. A single user request may trigger multiple LLM calls, several tool executions, and database queries across different services. When something goes wrong, you need to reconstruct the exact sequence of events, their timing, and their inputs and outputs. Distributed tracing provides this.
OpenTelemetry is the open standard for distributed tracing, supported by every major observability platform (Datadog, Honeycomb, Jaeger, Grafana Tempo). You instrument your agent code by creating spans around each logical unit of work: the overall agent run, each LLM call, and each tool execution. Spans are linked by a trace ID that follows the request through every service. When you look up a failing task ID, you see every step, its duration, and its output in a single view.
Alongside tracing, collect structured metrics using Prometheus or a compatible metrics system. The four metrics that matter most for agents are: total requests (with success/failure labels), response latency as a histogram (to compute p50, p95, and p99 percentiles), total tokens consumed per model, and current queue depth. Alert on error rate above 1% and p99 latency above your SLA (Service Level Agreement) threshold.
Common misconception
“Logging everything an agent does is sufficient for debugging production failures.”
Unstructured logs are hard to query at scale and do not capture the causal relationship between steps. Distributed tracing provides structured, linked spans that let you reconstruct the exact execution path of any request, including timing, inputs, outputs, and which steps failed. Structured logs and traces complement each other: traces show the what and when; logs provide the detail. Use both, with the trace ID linking them.
With an understanding of observability: distributed tracing and metrics in place, the discussion can now turn to cost management and multi-model routing, which builds directly on these foundations.
At 200,000 queries per day with an average of 1,500 tokens per query routed to a frontier model at $15 per million input tokens, the monthly LLM cost is approximately $135,000. This is before output tokens, which can add another 30-50%. Cost management is not optional at enterprise scale.
Multi-model routing addresses this by sending each task to the cheapest model that can handle it reliably. Simple classification tasks (is this email spam or not spam?) do not require a frontier model. A compact, fast model at $0.25 per million tokens handles them with equivalent accuracy. Complex multi-step reasoning, code generation, or tasks requiring high accuracy use a more capable model. Routing logic based on task complexity, expected token count, and required accuracy can reduce monthly LLM costs by 40-70%.
Alongside routing, implement token budget enforcement. Define a daily token ceiling per agent or per customer, with alerts at 80% consumption and hard stops at 100%. Without enforcement, a single runaway agent or prompt injection attack can exhaust a day's budget in minutes. Token budgets are an operational control, not an optional optimisation.
With an understanding of cost management and multi-model routing in place, the discussion can now turn to guardrails and output validation, which builds directly on these foundations.
Guardrails are programmatic constraints applied to agent inputs and outputs. They enforce safety, quality, and compliance requirements independently of the LLM. This independence is critical: a system prompt instruction that says "never include payment card numbers in your response" can be overridden by a sufficiently crafted prompt injection. An application-layer guardrail that runs a regex check on every response cannot be overridden regardless of what is in the context window.
Design guardrails in three categories. Blocking guardrails halt execution and return an error when triggered, for example detecting a potential credit card number in an output, or a response length that exceeds the contract. Warning guardrails log the issue and flag for human review but allow the response through, for example a response that mentions a competitor. Logging guardrails record the event for audit without affecting the response. Match the guardrail type to the severity of the constraint.
“The AI system provider shall establish, implement, maintain, and continually improve its AI management system, including the processes needed for it and their interactions.”
ISO/IEC 42001:2023 - Section 4.4: AI management system
ISO/IEC 42001:2023 is the international standard for AI management systems, analogous to ISO 27001 for information security. Compliance in regulated industries increasingly requires not just guardrails in code but a documented management system that governs how guardrails are defined, tested, and updated.
With an understanding of guardrails and output validation in place, the discussion can now turn to compliance architecture for regulated industries, which builds directly on these foundations.
Banking, healthcare, insurance, and legal sectors operate under regulatory frameworks that impose specific technical requirements on AI systems. Data residency rules require that data processed or stored for certain customers must remain within a specific jurisdiction. Self-hosted models or regional cloud endpoints satisfy this; routing all data through a single US-based API does not.
Audit trail completeness means every AI-assisted decision must be reconstructable: who requested it, what input was provided, which model version was used, what output was generated, and when. This requires immutable, timestamped logs stored for the regulatory retention period. In financial services this is often seven years. In healthcare, longer.
Model version pinning is critical in regulated contexts. LLM providers update models continuously. An update to the underlying model can change outputs for identical prompts. In regulated industries, treat model upgrades as software releases: pin to a specific model version, conduct regression testing against a labelled test set before switching, and document the change in your change management system. EU AI Act Article 13 requires that high-risk AI systems provide users with information about the AI system's capabilities and limitations, including the model version.
For AI decisions that affect individuals (loan approval, insurance risk scoring, hiring recommendations), implement a human review queue. Decisions above a risk threshold or confidence threshold below a minimum should route to a human reviewer before the decision is finalised. This satisfies both regulatory expectations and the practical need for error correction in high-stakes contexts.
Common misconception
“System prompt instructions are sufficient to prevent an agent from producing non-compliant outputs.”
System prompt instructions are interpreted by the LLM and can be overridden by sufficiently crafted inputs (prompt injection). Compliance-critical constraints must be enforced in application code, outside the context window: input sanitisation before the LLM sees it, output validation after the LLM produces it, and guardrail rules that operate on the response independently of what the model was instructed to do.
Your enterprise AI system routes all 200,000 daily queries to a frontier model at $15/million input tokens, with an average of 1,500 tokens per query. Monthly cost is $135,000. After analysis, 60% of queries are simple classification tasks that a compact model handles accurately at $0.25/million tokens. What is the approximate new monthly cost after routing those queries to the compact model?
Your observability shows p99 latency of 45 seconds for your agent. Which architectural change would most effectively reduce tail latency?
What is the primary advantage of placing guardrails in application code rather than relying on system prompt instructions for safety-critical constraints?
A regulated financial services firm asks why they need to pin to a specific model version rather than always using the latest version of their chosen LLM. What is the most complete answer?
ISO/IEC 42001:2023, Artificial Intelligence Management Systems
Section 4.4 (AI management system) and Section 9.1 (Monitoring and evaluation)
The international standard for AI management systems. Quoted in Sections 20.3 and 20.5 to establish the compliance framework for enterprise observability and guardrail governance.
opentelemetry.io, Tracing specification
The open standard for distributed tracing. Referenced in Section 20.3 as the recommended instrumentation framework for agent observability.
EU AI Act, Article 13: Transparency and provision of information
Regulation (EU) 2024/1689
Requires high-risk AI systems to provide users with information about capabilities, limitations, and the basis for AI-assisted decisions. Referenced in Section 20.6 in the context of model version disclosure.
JPMorgan AI Research, arXiv:2401.00908
The JPMorgan DocLLM paper demonstrating enterprise document AI requirements. Referenced in the opening case study to illustrate why enterprise AI architecture differs from prototype AI.
Prometheus documentation: Histogram and Counter patterns
prometheus.io/docs
The standard metrics collection system referenced in Section 20.3 for the agent latency histogram and token counter patterns.
Module 20 of 25 · Advanced Mastery